
think-cellAutomate charts and presentations in PowerPoint and Excel
think-cell is the leading add-in for Microsoft PowerPoint and Excel: it automates professional chart and slide creation, handling the manual work PowerPoint alone can't. A standard in consulting firms, finance teams and large enterprises.
What is think-cell?
think-cell is an advanced add-in for Microsoft PowerPoint and Excel, built for professionals who need to turn complex data into clear, reliable and visually professional presentations.
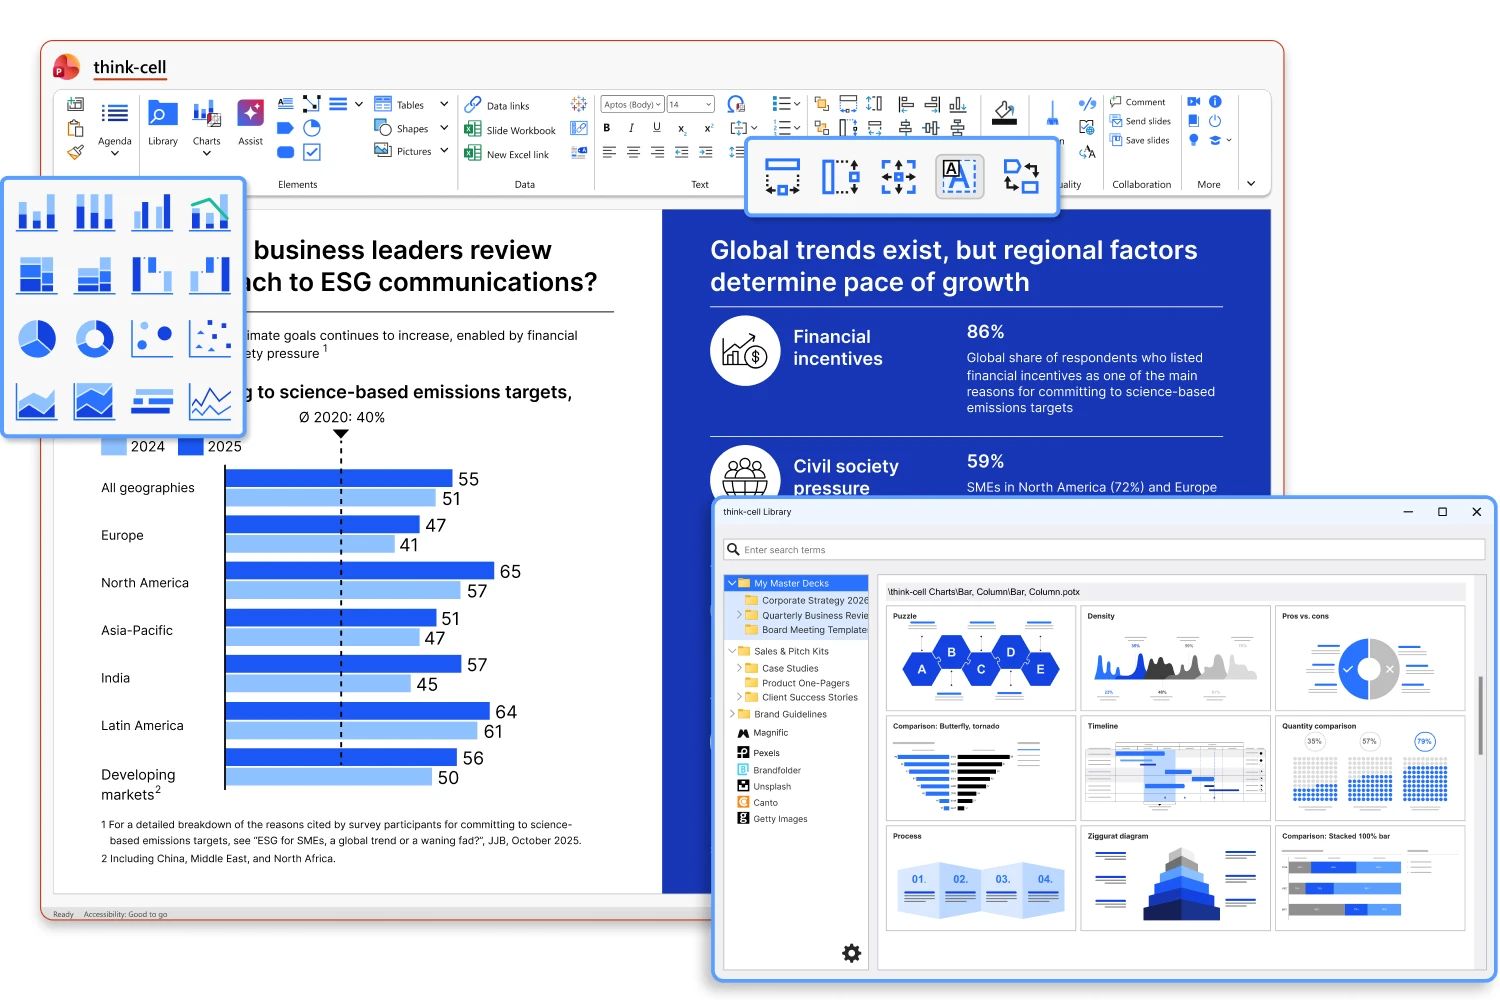
Used as a standard by consulting firms, finance departments and large companies, it removes manual tasks, reduces errors and speeds up chart creation — with 40+ professional chart types, from waterfall to Gantt, always linked to your Excel data.
think-cell in numbers
The preferred charting tool for those who present data for important decisions.
From data to a professional slide in seconds
think-cell takes over PowerPoint's manual work: you connect the data and it builds, calculates, aligns and updates the charts.
Automatic Charts
40+ professional types — waterfall, Gantt, Mekko, scatter, bubble and variance — built in a few clicks right inside PowerPoint.
Automatic Calculations
Totals, variances and percentages are calculated for you. No manual formulas, no typos, no rework.
Excel Integration
Link charts to your Excel data: when the numbers change, the slides update automatically.
Labels and Alignment
Labels, scales and alignment are adjusted intelligently, keeping charts always legible and proportional.
Visual Standardization
Ensure a consistent visual standard across the whole presentation and between company teams, effortlessly.
100% PowerPoint
Files remain standard, fully editable PowerPoint — think-cell complements, it doesn't replace.
think-cell for every type of analysis
For finance and controlling teams: charts that explain variances, result bridges and value composition with executive clarity.
Waterfall Chart
Explain the change between two values step by step — revenue, costs and result — instantly and visually.
Variance Analysis
Compare periods, budget vs. actual and scenarios with automatically calculated difference arrows.
Difference Arrows and CAGR
Highlight growth, decline and compound rates right on the columns, with no manual calculation.
Total and Percentage Labels
Totals and percentages appear and recalculate on their own whenever the data changes.
For PMOs and project leaders: professional schedules and timelines built and updated in minutes.
Gantt Chart
Build schedules with tasks, milestones and dependencies right on the slide, ready to present.
Timeline
Communicate phases, deliverables and deadlines in a clear, automatically aligned timeline.
Milestones and Dependencies
Add milestones and connections between tasks without manually drawing shapes.
Automatic Time Scale
The date scale adjusts itself as the project period changes.
For strategy and consulting: visualizations that reveal share, segmentation and correlations in a single slide.
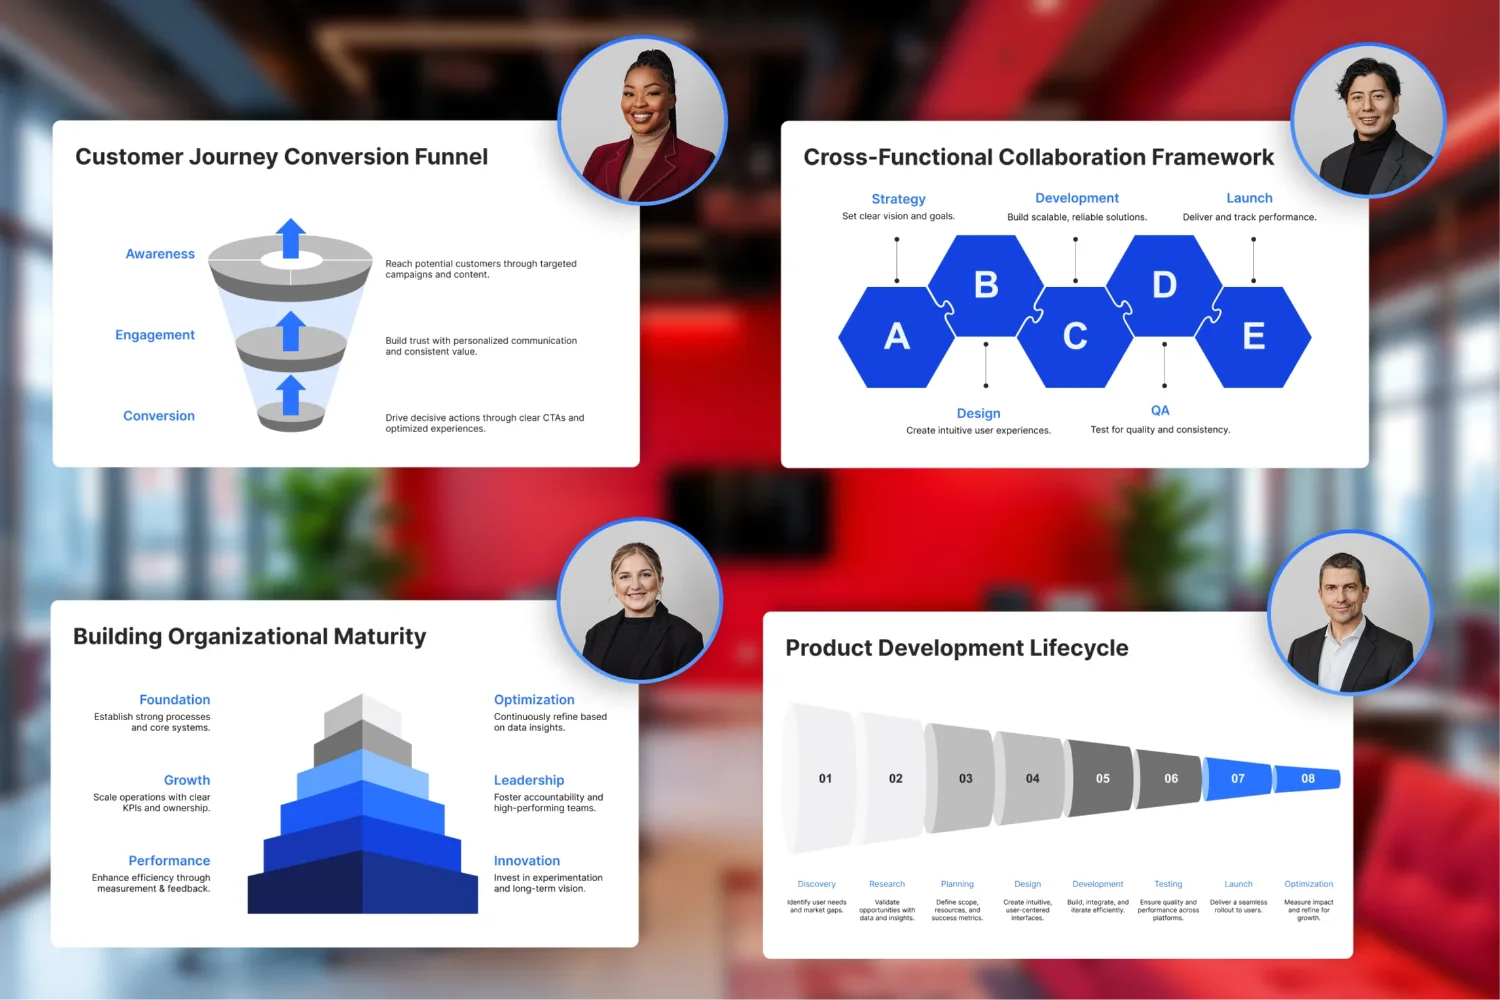
Mekko and Marimekko
Show market share and segmentation across two dimensions, ideal for competitive analysis.
Scatter and Bubble
Reveal correlations and position players by multiple variables in scatter and bubble charts.
Pie, Doughnut and Bars
Classic compositions and comparisons with always-correct labels and proportions.
Agenda and Tables
Create agendas and tables aligned to the presentation's visual standard, with no manual tweaking.
think-cell Assist: your AI slide copilot
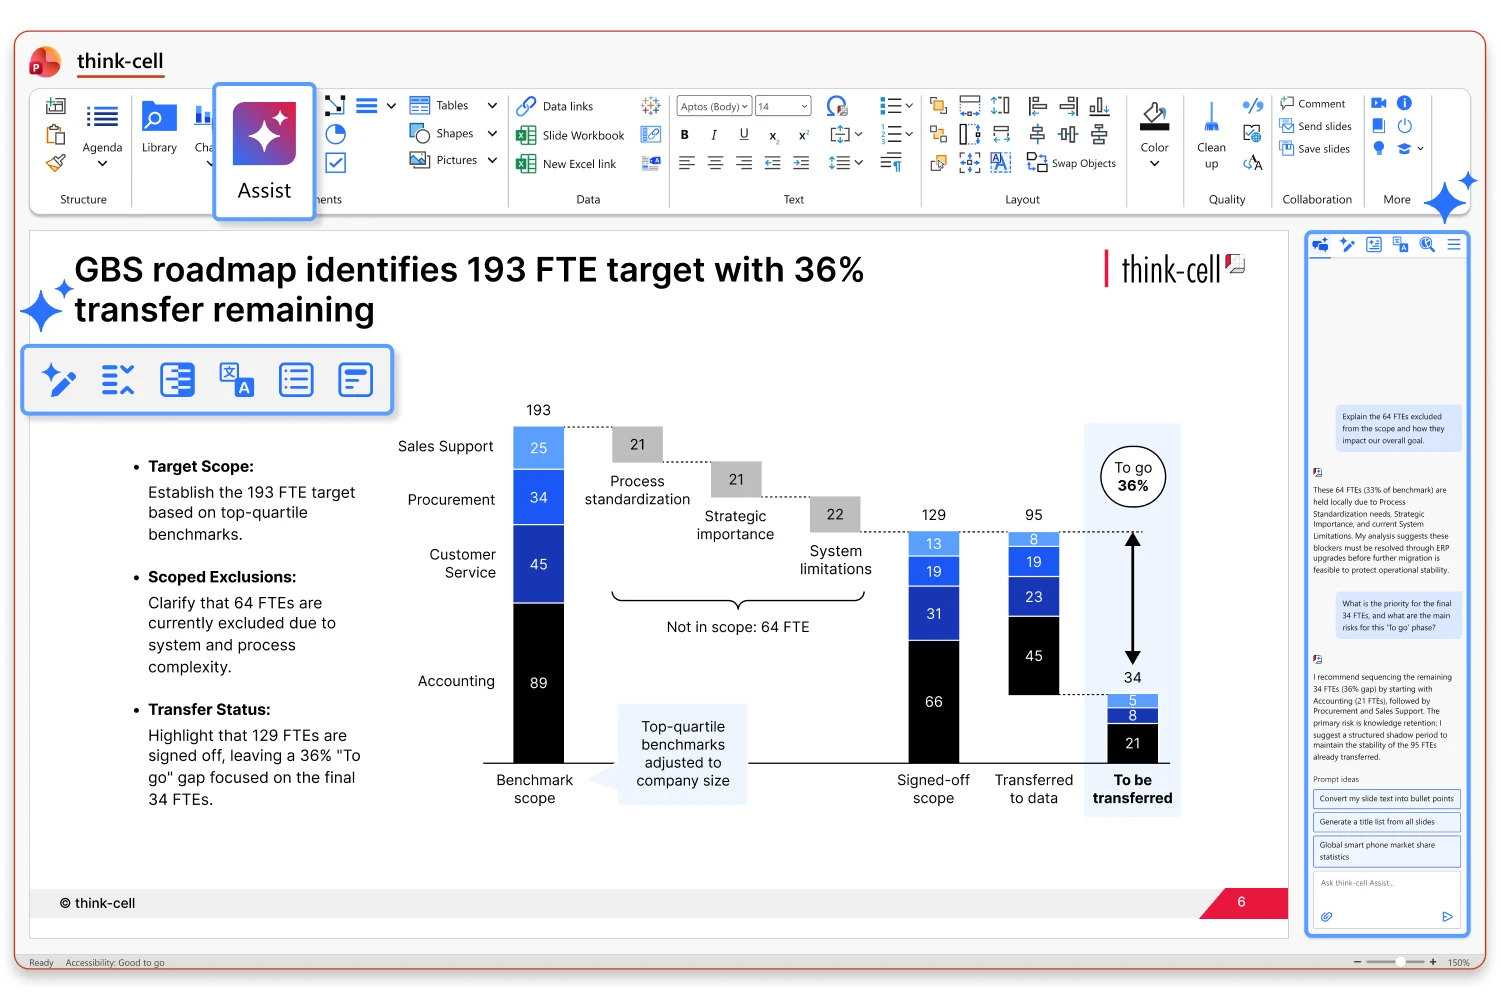
think-cell Assist uses artificial intelligence right inside PowerPoint: describe what you need and get chart, structure and text suggestions ready to fine-tune — without leaving your presentation.
Turn raw data and rough drafts into consistent visual narratives, with message titles, bullets and the right chart for each analysis, all while keeping your company's visual standard.
- Chart suggestions from your description or your data
- Message titles and bullets generated automatically
- Agenda and storyline structured in seconds
- You stay in control: everything remains editable in PowerPoint
See think-cell in action
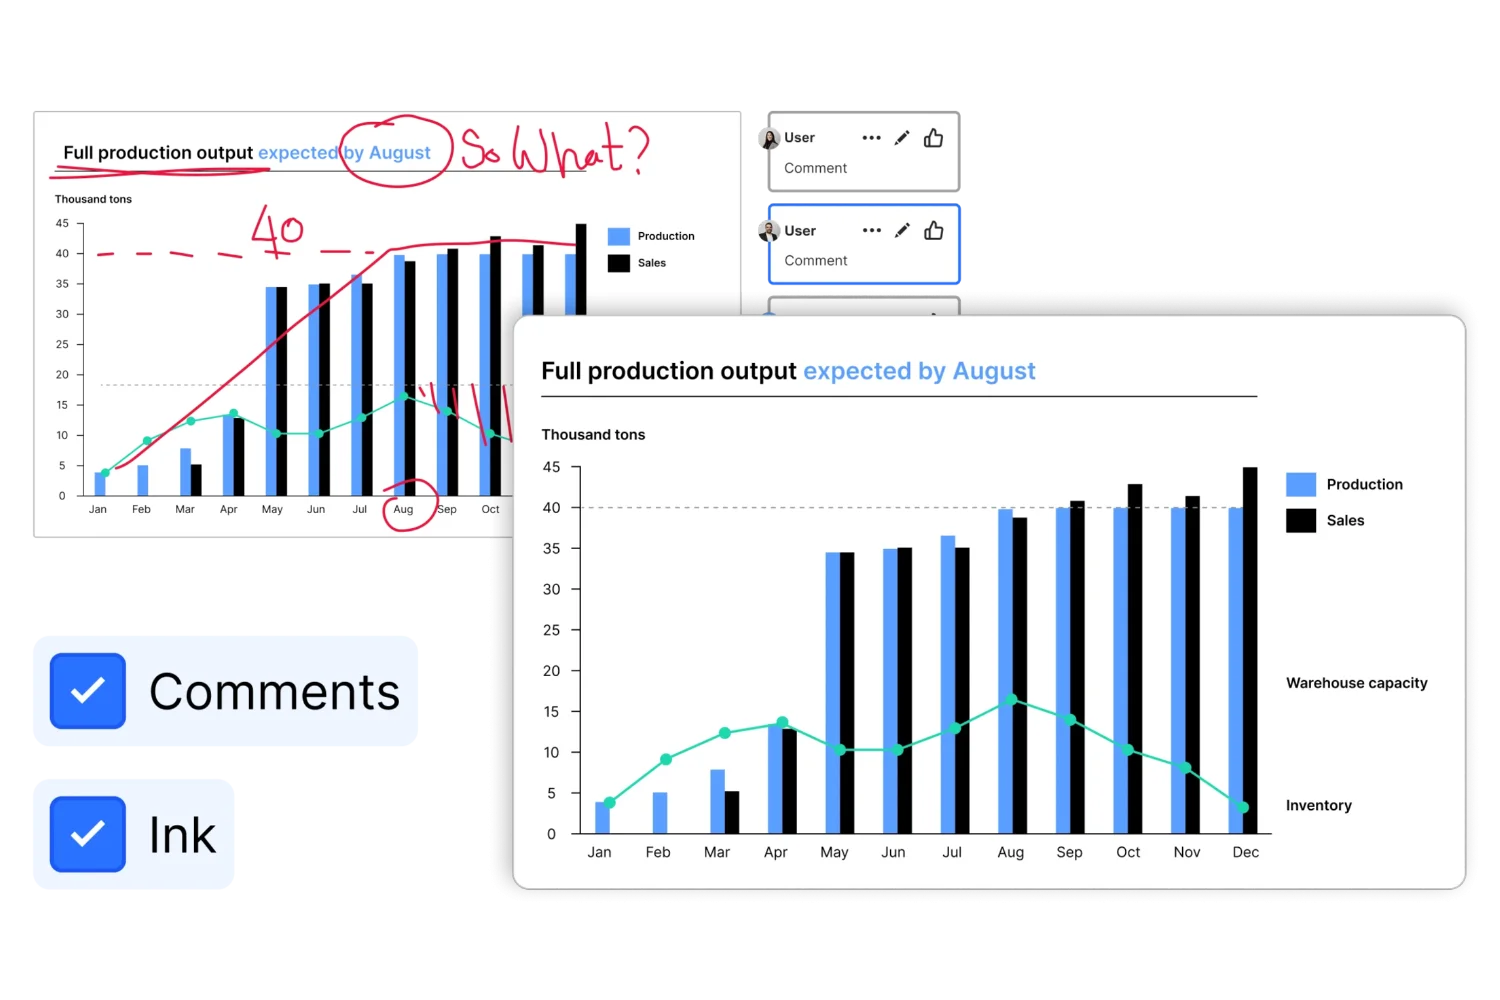
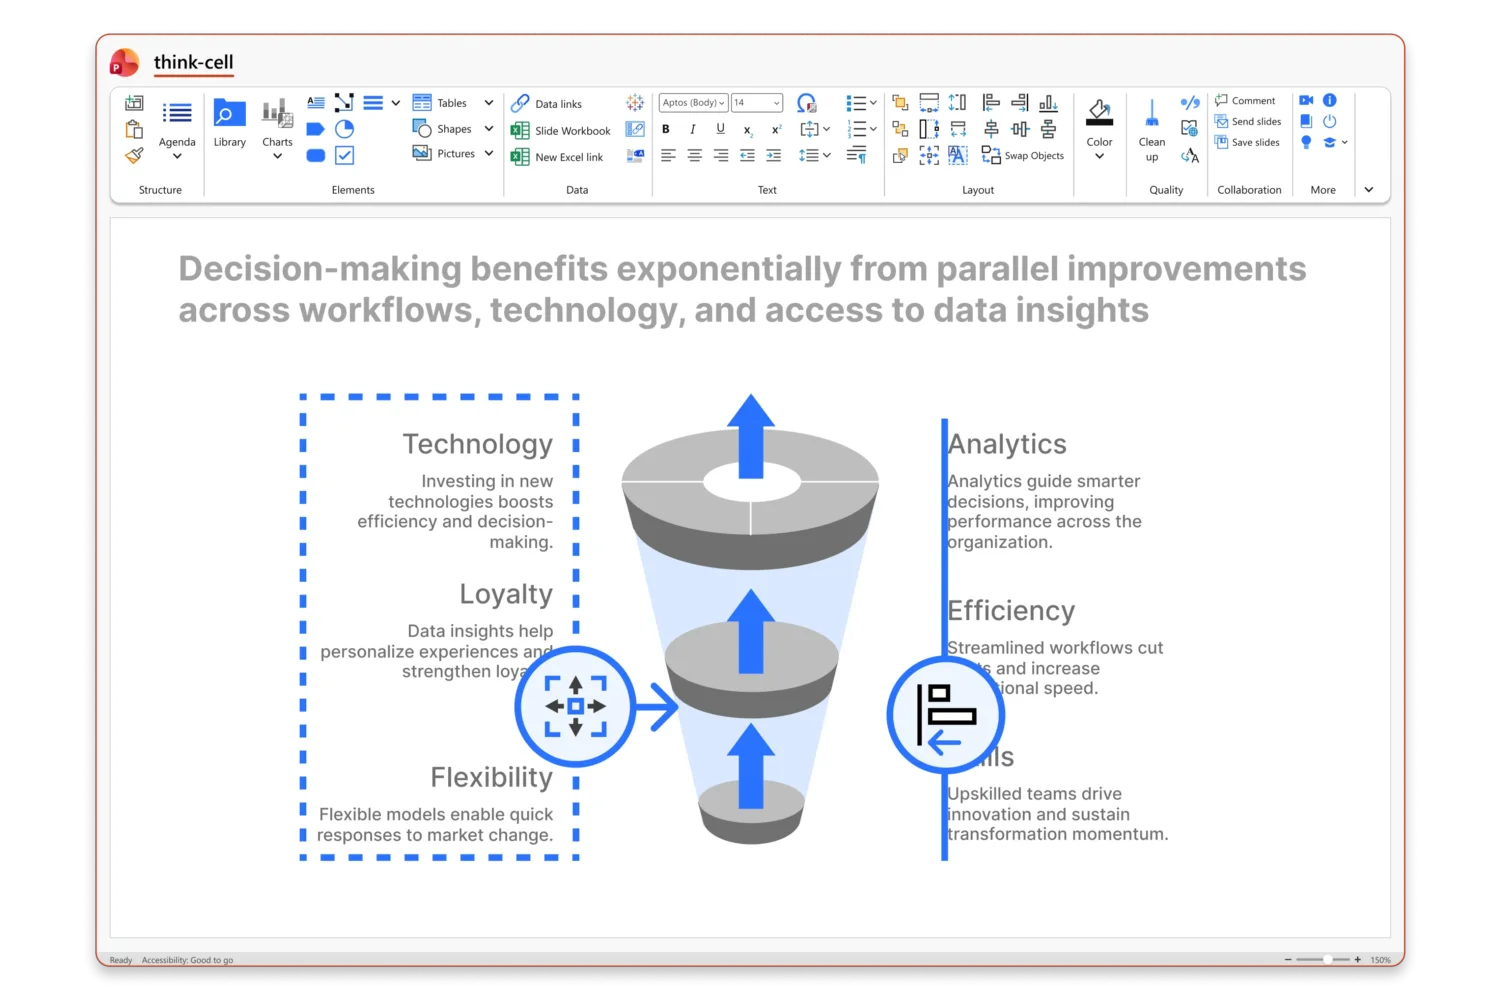
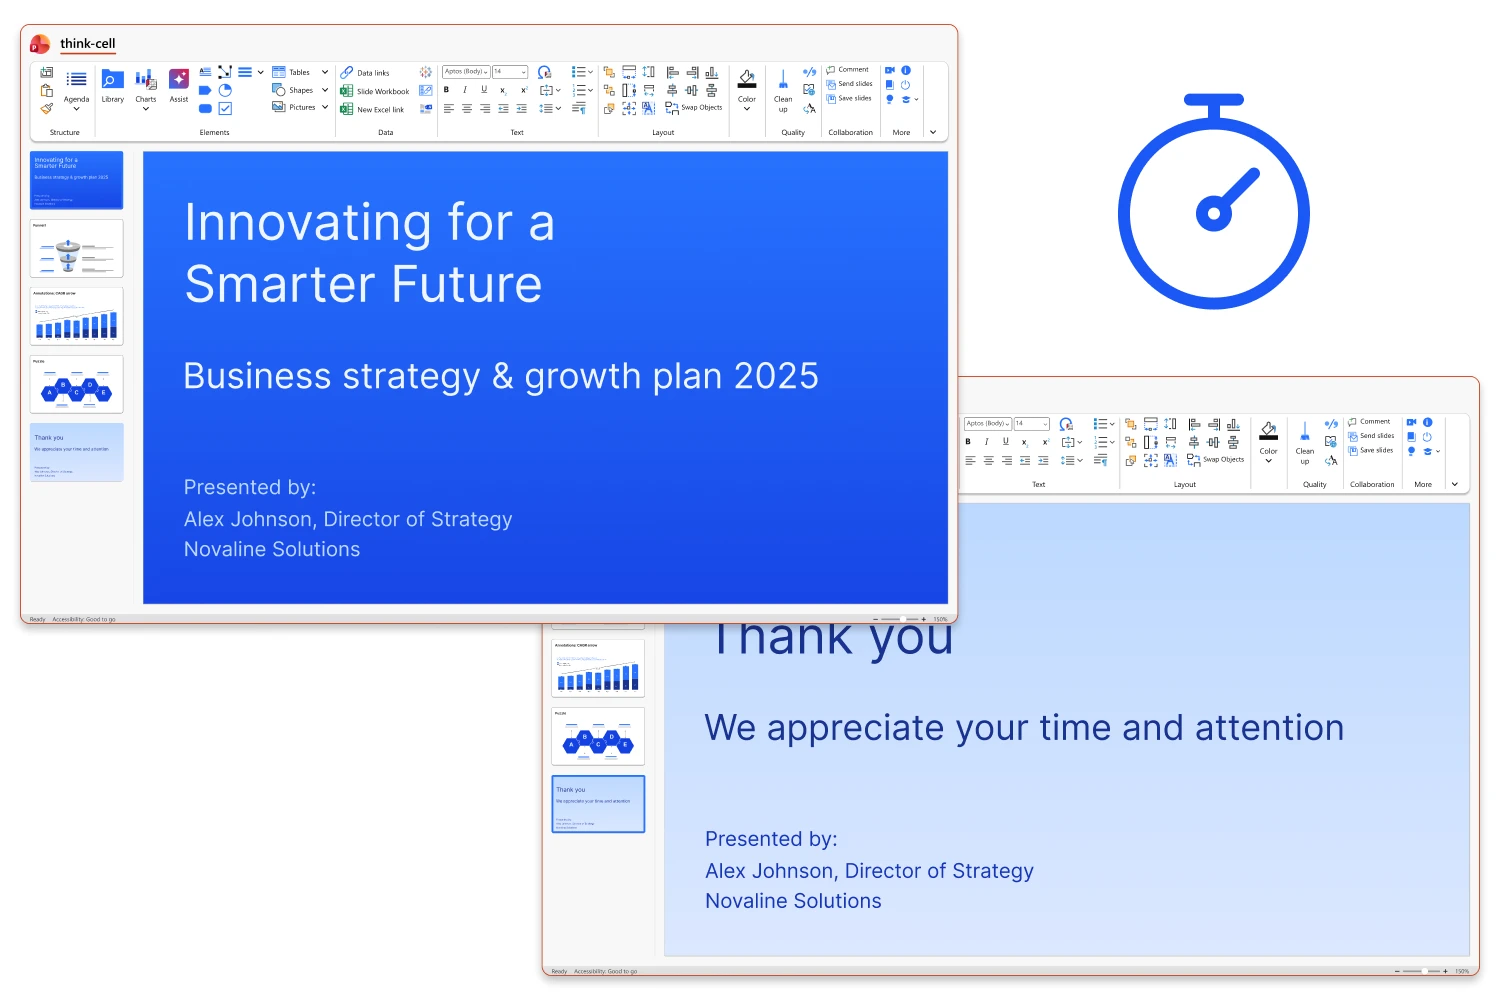
From chart to finished slide: features that speed up production and raise the quality of every presentation.
Requirements and Compatibility
A native Microsoft Office add-in — lightweight, quick to install and compatible with Windows and Mac:
Supported Office editions:
- Windows: Microsoft Office 2013, 2016, 2019, 2021 and 2024 (32 and 64-bit).
- macOS: Microsoft Office 2019, 2021 and 2024 for Mac, on macOS Big Sur (11) or later.
Beauty isn't in the eye of the beholder — it's in the data
think-cell automatically calculates totals, variances and percentages, adjusts labels, scales and alignment and keeps everything consistent — so you focus on the message, not the manual work.
When the data changes, the slides update themselves. Link your charts to Excel and every new version of the report is generated in seconds, with no rework and no typos.
With 40+ chart types — waterfall, Gantt, Mekko, scatter, bubble, variance and many more — you build analyses that used to take hours in just a few clicks.
The result: up to 70% less time creating and updating charts, fewer manual errors and more time for what matters — analysis and decisions.
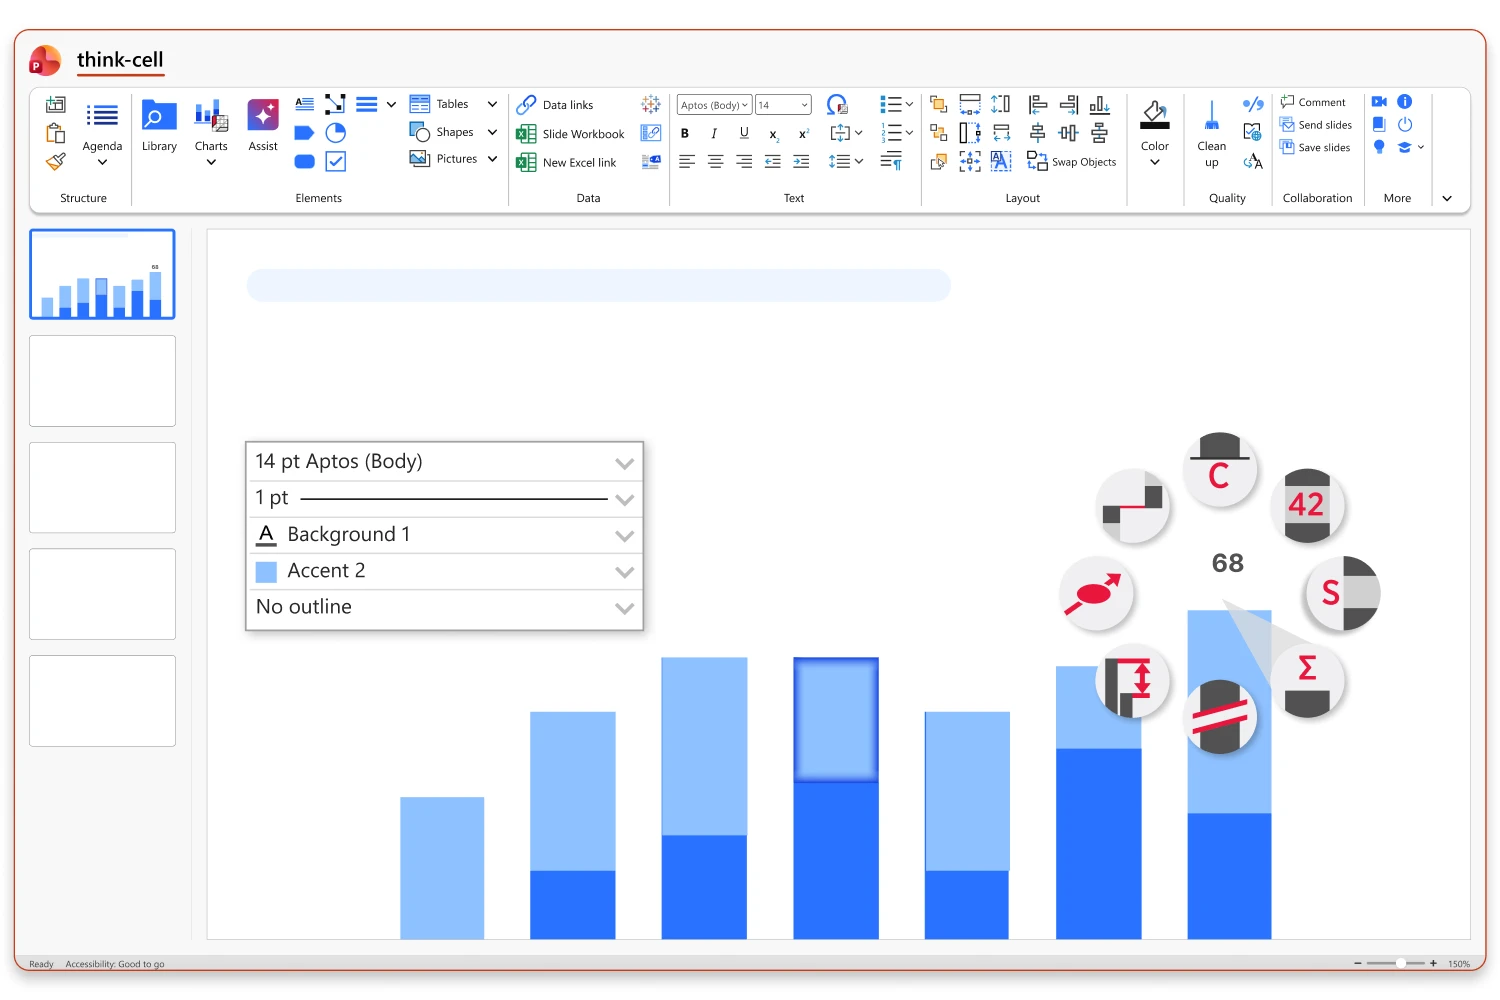
Automation that saves up to 70% of your time
Tasks that eat up hours — positioning elements, calculating percentages, aligning axes — are handled automatically by think-cell. Real consulting cases cut reports from 10+ hours to around 3 hours.
Less manual adjustment means fewer errors, less rework and faster delivery — with a consistent visual standard across the whole presentation.
The standard of market leaders
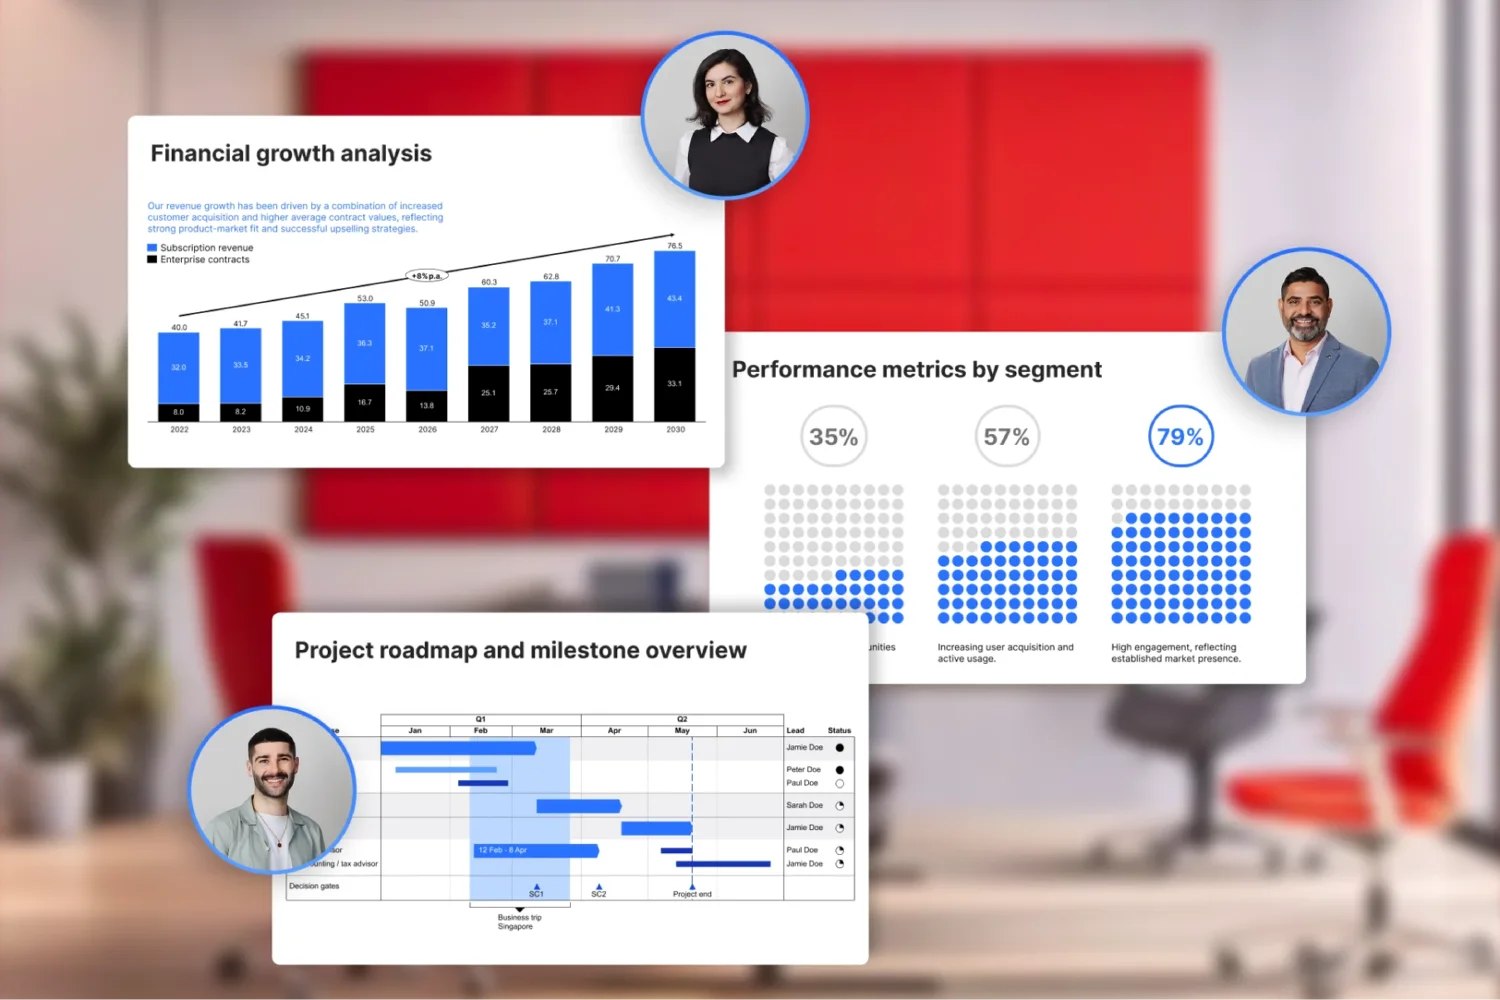
think-cell is used by 9 of the 10 largest consulting firms, 9 of the 10 top business schools and 89 of the Fortune 500 — the tool of choice for those who present data for high-level decisions.
Standardize your team's presentations, ensure consistency across teams and raise the quality of every slide delivered to clients and executives.
Frequently Asked Questions about think-cell
How much does think-cell cost?
OSB Software prepares personalized proposals for think-cell based on the number of licenses (users) and the contracting model. The license is per user, on an annual cycle, with local invoicing in Brazil. Request a proposal through the form or talk to Sofia for commercial terms.
What is think-cell?
think-cell is an add-in for Microsoft PowerPoint and Excel that automates professional chart creation and slide layout. With 40+ chart types and direct Excel linking, it cuts the time spent on charts by up to 70% and is a standard in consulting firms and finance teams.
Does think-cell replace PowerPoint?
No. think-cell complements PowerPoint and Excel — it installs as an add-in and adds chart automation features Office doesn't have natively. You keep working inside PowerPoint, with all of its features.
Is it hard to learn?
No. The learning curve is fast for anyone already using Excel and PowerPoint. Charts are created intuitively and, in a short time, the team produces professional presentations much faster.
Do files stay editable for people without think-cell?
Yes. Files remain in standard PowerPoint format and can be opened and edited normally. think-cell charts stay fully editable for anyone who has the add-in installed.
Does think-cell work on Mac?
Yes. think-cell is compatible with Microsoft Office 2019, 2021 and 2024 for Mac, running on macOS Big Sur (11) or later — in addition to Office 2013 through 2024 on Windows.
How can I buy think-cell in Brazil?
OSB Software is an official think-cell partner and supplies the license in Brazil with local invoicing and no need for an international credit card. The process starts with a qualification conversation, followed by a commercial proposal and license delivery after the contract is signed.
What type of invoice does OSB issue for think-cell?
OSB issues an NFS-e (Brazilian electronic service invoice) due to tax requirements arising from the STF decision that classified software operations under ISS. The legal nature of the operation is the supply of an off-the-shelf software license, even though the fiscal document issued is a service invoice.
Does think-cell help standardize the team's presentations?
Yes. It keeps a consistent visual standard across charts, slides and teams, which supports brand governance and the quality of deliverables. It's one of the main reasons consulting firms and large companies adopt it as a standard.
Can charts be linked to Excel data?
Yes. Charts can be linked directly to Excel spreadsheets. When the data is updated, the charts and slides update automatically, eliminating rework and typos.
Those who buy with OSB Software recommend it
Buying with OSB Software was excellent. We cut license procurement from 4 months to 15 days, increasing user satisfaction. Today we buy in a more assertive and faster way, with support in choosing the best license. I highly recommend OSB Software: they are partners who support you at the right moment and improved our software process.
Our partnership with OSB Software fulfilled our long-held wish for a strong partner for our software catalog. Since last year, we have reaped significant results, with more agility in the process and easier management, greatly strengthening how we manage the acquisition of new licenses in the company.
Why buy think-cell from
OSB Software?
OSB Software is an official think-cell partner in Brazil, a reference in technology solutions with 100% genuine licenses, security and full compliance for your business.
- Consultative, specialized service from professionals who understand your needs.
- Fast, secure processes, from payment to license delivery.
- Dedicated commercial follow-up, from proposal to license delivery and renewal.
- Flexible invoicing, with terms that adapt to your operating model.
- Proven credibility, with thousands of customers served across Brazil.
Keep your imported software properly licensed: choose OSB Software for reliable technology, qualified service and a simple, transparent, hassle-free purchase.
Contact Us