
SigmaPlot
SigmaPlot software makes data visualization simple and easy to analyze. It has more than 100 types of 2D and 3D technical charts.
SigmaPlot software makes data visualization simple and easy to analyze. It has more than 100 types of 2D and 3D technical charts.
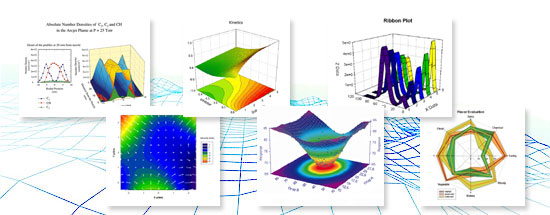
SigmaPlot is an industry-leading scientific graphing and statistical analysis software. With its intuitive and easy-to-use interface, users can generate high-quality graphics quickly and efficiently. With more than 100 types of 2D and 3D technical graphs, the tool offers a wide variety of visualization options to meet users' needs.
In addition, SigmaPlot offers advanced features such as customizable axis scales, multiple axes and multiple 3D plot crossings, allowing users to create complex and accurate plots with ease. With the ability to publish charts across multiple platforms, users can share high-quality data and charts with their coworkers and on the web.
In summary, SigmaPlot is the ideal solution for scientists, engineers, teachers and students who want to present their data in a clear and convincing way. With its wide range of features and customization options, SigmaPlot allows users to create professional quality plots without having to spend hours in front of the computer.
With SigmaPlot, you can create and publish stunning graphs anywhere on the web. With a wide choice of 2D and 3D technical graphics, this program is ideal for analyzing data accurately and clearly. Additionally, SigmaPlot offers seamless integration with Microsoft Office, making it easy to access and present results in PowerPoint presentations. Share your high-quality charts easily and efficiently, making your data accessible to everyone. Try SigmaPlot today and see the difference it can make to your research and data analysis.
SigmaPlot is advanced graphing software that takes you beyond simple spreadsheets, allowing you to show your data clearly and concisely. With over 100 types of technical charts available, you can produce high-quality charts in just a few clicks, saving you valuable time. Furthermore, SigmaPlot offers seamless integration with Microsoft Office, allowing you to easily access your data in Excel spreadsheets and present your results in PowerPoint presentations. With SigmaPlot, you can take your data analysis and presentations to the next level.
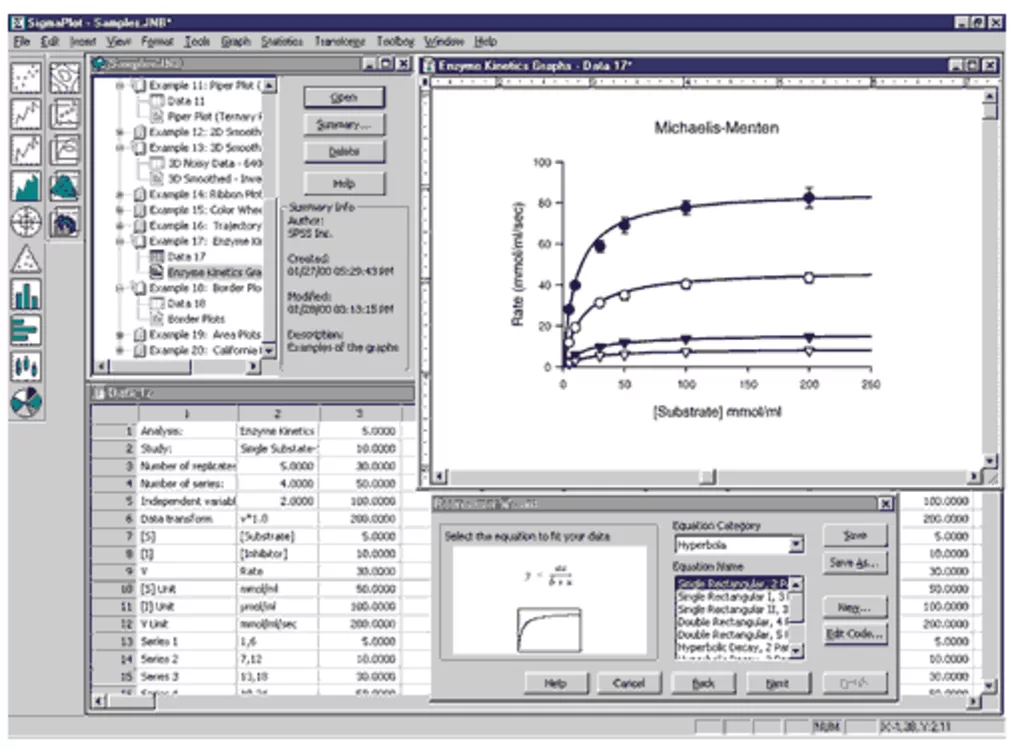
Start creating high-quality graphs with SigmaPlot's award-winning interface. With industry-standard drawing menus, menu bars, and right-click support, charting has never been easier. Select the desired chart type from the easy-to-view icons on the chart toolbar.
The Interactive Chart Wizard takes you step-by-step through the creation of your chart. With SigmaPlot, you can create compelling, professional-quality, highly customizable graphs. With more options for modeling and visualizing technical data than any other charting software package, SigmaPlot gives you all the tools you need.
Analyze your data with ease by creating multiple axes per chart, multiple charts per page, and multiple pages per worksheet. Arrange multiple plots on a single page using built-in templates or create your own with SigmaPlot's page layouts and zooming features. With SigmaPlot you can create high quality interactive graphs that will wow your audience
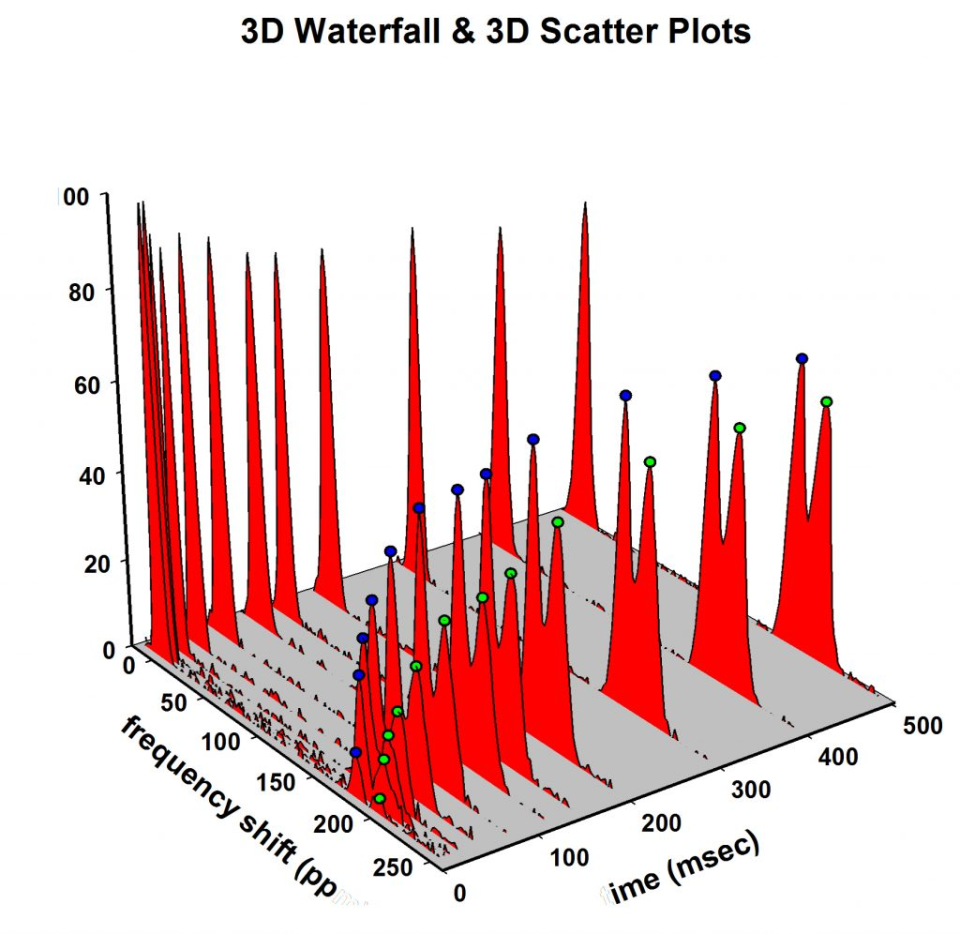
With over 80 types of technical graphs available in 2D and 3D, SigmaPlot allows you to create custom graphs that best represent your data. From simple scatterplots to contour plots, the tool offers flexibility and advanced features for data visualization.
In addition to the vast array of chart choices, SigmaPlot gives you the flexibility to customize every detail of your chart. With the ability to add axis breaks, standard or asymmetric error bars, symbols, change colors, fonts, line thickness and more, the software allows for precise and personalized adjustments to each graphic element. With the "Properties" dialog box, you can modify the graph, chart or diagram by adding an equation, symbol, map, figure, illustration or other image to your presentation.
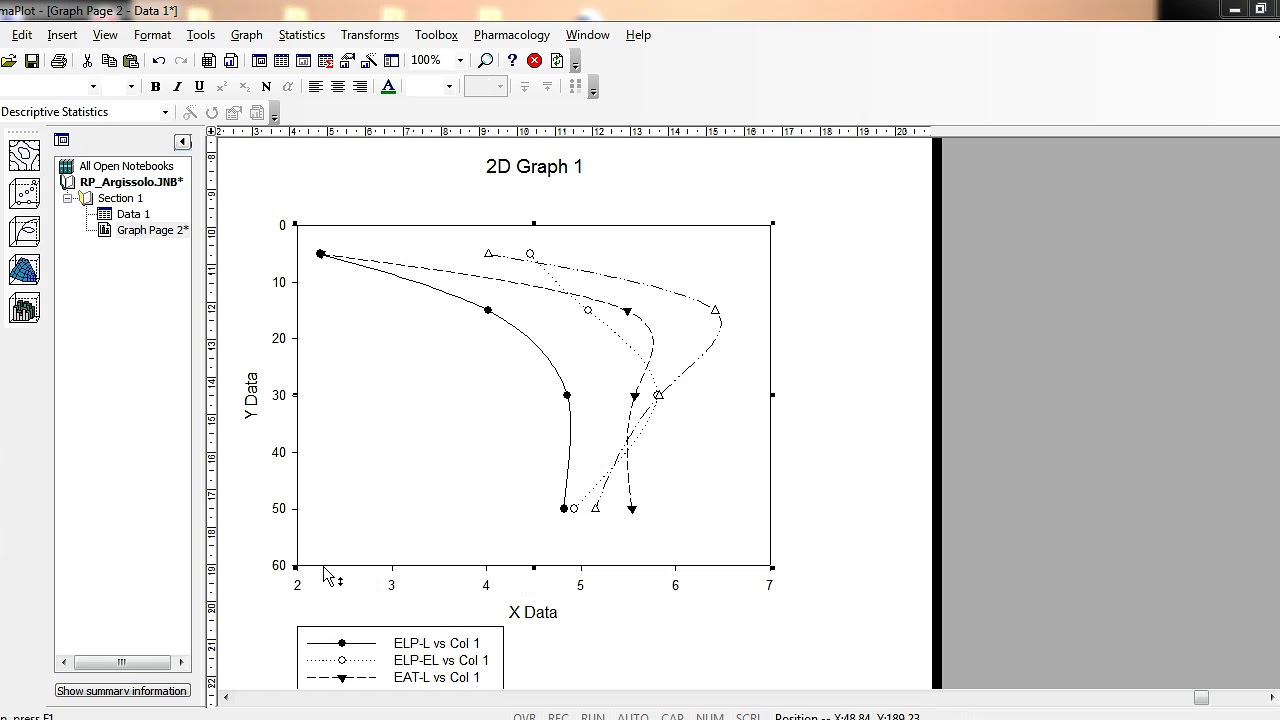
Statistical analysis is a crucial process in many areas of science, from medical research to engineering and biology. With SigmaPlot software, you can explore your data effectively and efficiently using the most advanced statistical analysis tools available on the market.
With an award-winning, easy-to-use interface, SigmaPlot offers over 80 types of 2D and 3D technical graphs to visually represent your data. From simple scatter plots to more complex contour plots, SigmaPlot has the ideal option for your statistical analysis.
SigmaPlot's flexibility allows you to customize every detail of your graph, adding axis breaks, error bars, changing colors, fonts, line weights and much more. By creating multiple axes per chart, multiple charts per page, and multiple pages per worksheet, it's easy to organize and present your results clearly and concisely.
In addition, SigmaPlot offers seamless integration with Microsoft Office, allowing you to access data directly from Microsoft Excel and present your results in Microsoft PowerPoint presentations. It is also possible to publish high quality graphs on the web with SigmaPlot, making it easy to share results with colleagues and collaborators.
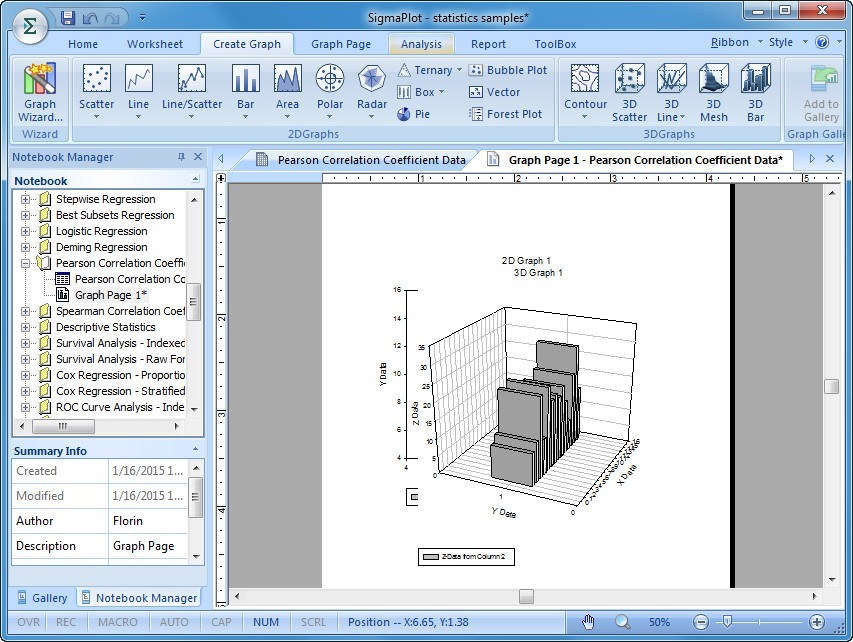
By integrating SigmaPlot with Microsoft Office, you can easily and conveniently create graphs without having to switch between different software. With easy access to Excel data and the ability to present your results in PowerPoint, you can produce high quality charts in a much shorter time.
The integration also allows you to work with spreadsheets and data in real time, as well as being able to customize your charts according to your needs. SigmaPlot features an award-winning interface, industry-standard drawing menu, and easy-to-view icons on the graphing toolbar, all to ensure a simpler, more intuitive graphing experience.
With the ease of creating and customizing charts built into Microsoft Office, you can focus on analyzing your data and presenting your results clearly and effectively. Harness the power of SigmaPlot and Microsoft Office to create charts that impress your colleagues and help you achieve your research goals.
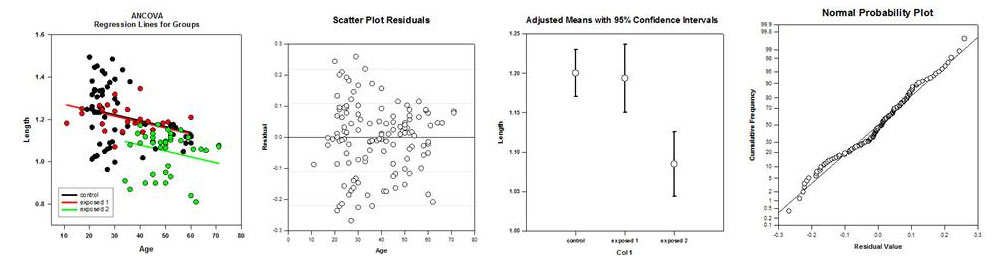
Share your results quickly and easily with SigmaPlot! With the high-quality web publishing tool, you can share your results with the world in minutes. SigmaPlot offers an easy-to-use, complete solution for publishing professional-quality graphs to the web, allowing you to share your findings with colleagues and clients around the world.
With powerful yet easy-to-use features, SigmaPlot's chart publishing tool lets you create and publish professional-quality charts in just a few clicks. You can customize every aspect of your graphic, from colors to fonts, and add annotations and captions to make your message clear and concise.
With SigmaPlot's seamless web integration, you can easily share your plots on any online platform. Simply export your chart to a web-compatible format and share it on your personal page, a blog, or any other platform you like.
Don't waste time struggling to share your results with the world. With SigmaPlot, you can publish high-quality graphs to the web in minutes and share your findings with colleagues and customers around the world. Try it today and discover how easy and effective data analysis can be!
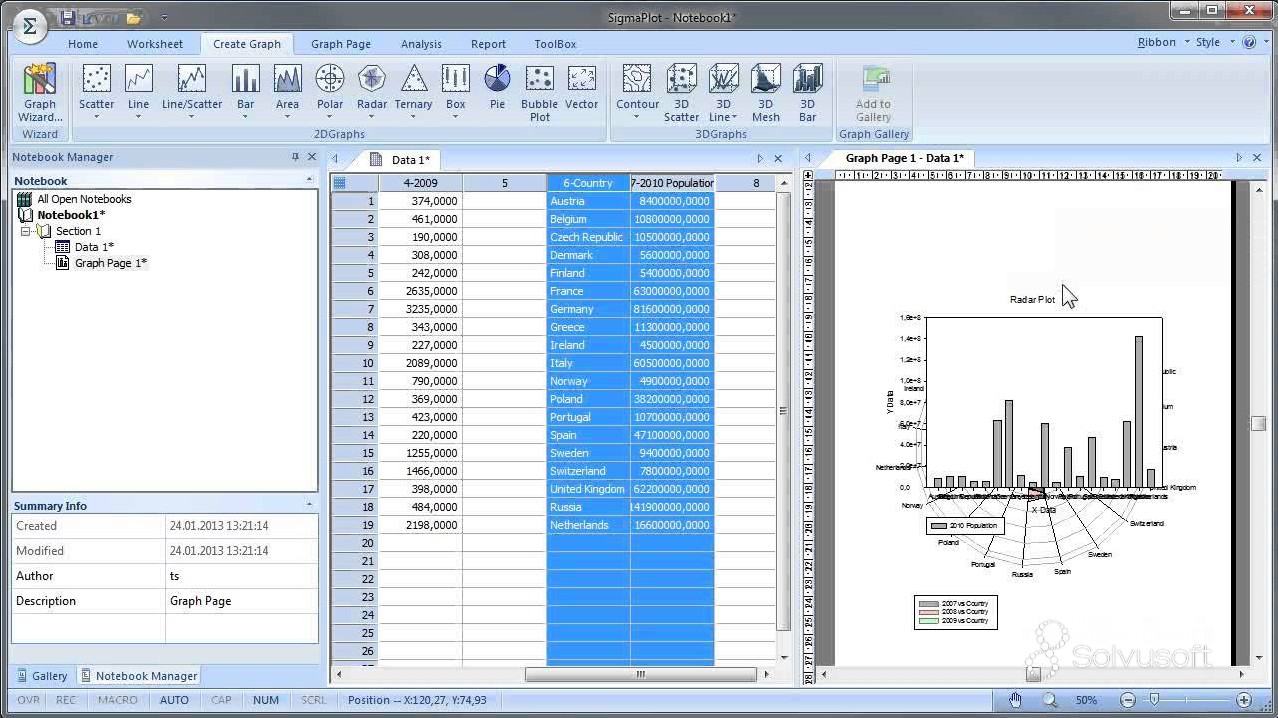
SigmaPlot is a powerful data analysis and plotting tool used by scientists, engineers, and researchers around the world. But in order for you to enjoy all the features that the software offers, it is important to make sure that it is compatible with your operating system. Fortunately, SigmaPlot is compatible with many versions of Windows and Mac OS X, and its hardware requirements are relatively modest. Below are the system requirements for SigmaPlot so that you can check whether the software is suitable for your computer.
If your computer meets SigmaPlot's system and hardware requirements, you are ready to take advantage of all the features that the software offers. Take advantage of the flexibility and power of SigmaPlot to analyze your data and create professional graphs on different operating systems, from Windows to Mac OS X. Download SigmaPlot now and start exploring your data efficiently and productively!
You don't know what software you need or you haven't found what you were looking for? We have a team ready to help you choose the right software for your company.